
It is three in the morning: users write that the Prowid Photos feed is slow. The dashboard says the CPU is fine and the servers are alive. Where do you look for the cause? Observability is the ability to understand what happens inside a system from what it puts out. In this lesson we will learn three kinds of signals — logs, metrics and traces — the RED and USE methods, SLIs, SLOs and the error budget, and how to set up alerts that wake you up for a reason.
Why observability
Monitoring answers questions you thought of in advance: «is the CPU above 80%?». Observability lets you ask a question you did not think of: «why is the feed slow only for users from Baku and only in the evening?». After the move to several services (the previous lessons) this is vital: one request passes through five processes, and «look at the server logs» no longer works.
An analogy — a doctor. Metrics are temperature and blood pressure: you quickly see that something is wrong with the patient. Traces are a scan that shows which organ has the problem. Logs are the medical history: what exactly happened and when.
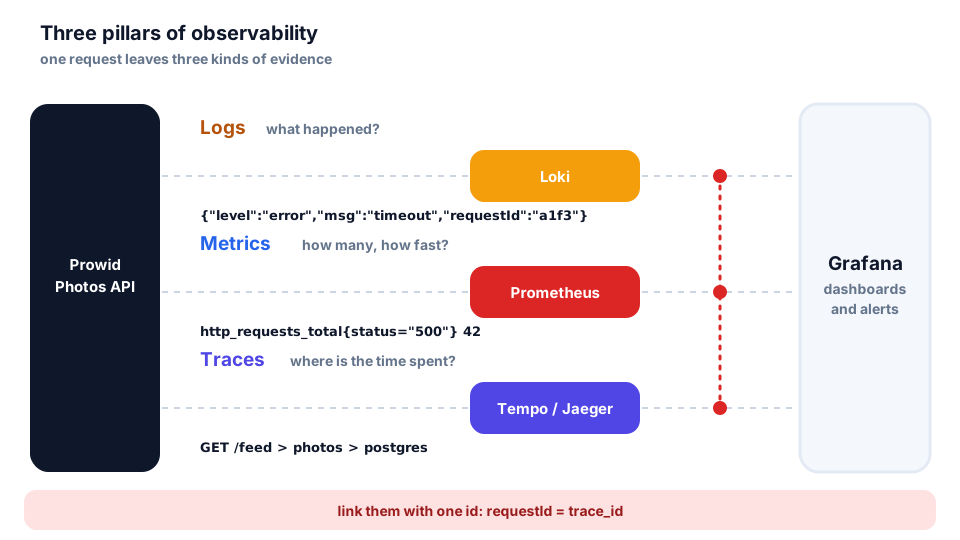
| Answers the question | What it is | Price | |
|---|---|---|---|
| Logs | what exactly happened? | events with details | lots of space; costly search |
| Metrics | how many and how fast? | numbers over time | cheap, but no details |
| Traces | where was the time lost? | the path of one request | detailed, so a sample is taken |
A typical investigation: a metric shows that the feed p95 grew from 300 to 900 ms (the symptom); the trace of one slow request points to the notifications call (the place); the log of that call explains why (the cause).
Logs: structured and with an id
The line console.log('error ' + err) is readable for a human, but not for a search: try finding all errors of one user in an hour. A structured log is JSON with fields you can filter by. Levels (debug, info, warn, error) let production write only the important things. The pino library (you met it in the logging lesson of Next.js) writes one JSON object per line.
The main find is the correlation id (request id): a unique identifier that lands in every log line of this request, is passed to other services in the x-request-id header and is returned to the client. Now one id gathers the history of a request from all services.
import pino from 'pino';
import { randomUUID } from 'node:crypto';

export const logger = pino({
  level: process.env.LOG_LEVEL ?? 'info',
  base: { service: 'prowid-api' },
  redact: ['req.headers.authorization', 'password'], // never log secrets
});

export function requestId(req, res, next) {
  const id = req.get('x-request-id') ?? randomUUID(); // reuse the caller's id
  req.log = logger.child({ requestId: id }); // every line carries the id
  res.set('x-request-id', id); // the client can quote it in a bug report
  const started = Date.now();
  res.on('finish', () => {
    const ms = Date.now() - started;
    req.log.info({ status: res.statusCode, ms }, 'request done');
  });
  next();
}
The log line will look like this (by default pino writes the level as a number: 30 is info):
