
When an organization grows from a single office into a distributed enterprise with regional branches, data centers, and multicloud services, building a resilient network cannot be achieved merely by buying expensive routers. The network architect serves as the primary bridge between executive leadership and engineering teams: translating high-level business goals (service availability, budget boundaries, operational continuity, and regulatory compliance) into rigorous technical specifications for topologies, protocols, and redundancy models. In this lesson, we examine the Cisco PPDIOO network lifecycle methodology, contrast Top-Down design with legacy Bottom-Up approaches, calculate availability and downtime budgets under contractual SLAs, and configure Cisco IP SLA probes to validate network performance metrics against architectural baselines.
Goal and prerequisites
After this lesson, you will be able to:
- articulate the fundamental differences between the role of a network architect, a network designer, and an operational network administrator;
- explain the purpose, inputs, and deliverables of each of the six phases of the Cisco PPDIOO lifecycle (
Prepare,Plan,Design,Implement,Operate,Optimize); - translate executive business requirements (availability, RTO, RPO, regulatory compliance, CAPEX, and OPEX) into measurable network engineering metrics (MTBF, MTTR, latency, jitter, packet loss, and oversubscription);
- calculate annual, monthly, and weekly downtime budgets for
99.9%,99.99%, and99.999%(«five nines») availability targets and estimate the business cost of unplanned outages; - conduct a baseline network audit using the Top-Down methodology, build an application traffic matrix, and formalize architectural design constraints;
- configure Cisco IP SLA UDP Jitter probes and verify that latency, jitter, and packet loss conform to design specifications on Cisco IOS XE.
What you need to know beforehand: core networking foundations from ccna — the TCP/IP suite, IPv4/IPv6 addressing, basic routing and switching concepts, and the fundamentals of latency (Latency) and bandwidth (Bandwidth).
A real-life task
A major commercial bank headquartered in Baku is launching a mission-critical digital banking and real-time payment card processing platform. In the boardroom, the Chief Executive Officer outlines the mandate: «This payment platform is the core of our business. Our customers must never encounter transfer failures, unplanned downtime during any disaster must not exceed five minutes, dropping even a single financial transaction is strictly unacceptable, and the entire architecture must fully comply with the PCI-DSS 4.0 security standard».
The IT infrastructure manager suggests an intuitive shortcut: «Let us simply procure top-of-the-line flagship switches for the server room and lease two identical gigabit Internet links from two different service providers».
Three months after commissioning, road construction excavators accidentally sever a municipal utility conduit where both providers' fiber cables happened to share the exact same physical trench. Simultaneously, the routing protocol requires more than two minutes to detect the failure and reconverge. Payment processing halts for 4 hours. The bank is penalized \$150,000 by the financial regulator for violating payment settlement continuity regulations, and valuable clients migrate to competitors.
Why did purchasing premium hardware without architectural analysis fail to protect the business? How should a network architect have formalized the board's mandates into RTO (Recovery Time Objective), RPO (Recovery Point Objective), 99.999% availability, and physically diverse fiber paths? Let us examine the engineering calculations.
The network architect role and the PPDIOO lifecycle
A network engineer or administrator focuses primarily on execution: «How do I configure this device right now?» — adjusting interface parameters, implementing access lists, and troubleshooting immediate outages. In contrast, a network architect (Network Architect) answers strategic questions: «Why are we building this specific architecture? How will this design accommodate business growth over the next 3 to 5 years? How much revenue does the company lose per minute of downtime, and what is the mathematical cost of mitigating that risk?».

To structure network evolution systematically, Cisco introduced the PPDIOO methodology — a comprehensive six-phase corporate network lifecycle:
- Prepare — conceptualization and business justification. The architect establishes financial targets, return on investment (
ROI), and total cost of ownership (TCO). For an e-commerce enterprise, the architect quantifies the monetary value generated by each minute of network uptime. - Plan — baseline discovery and audit. The existing network (
As-Is), fiber duct pathways, equipment rack capacities, and power/cooling availability (Site Readiness) are audited. Application traffic flows are profiled, and binding architectural constraints (Constraints) are cataloged. - Design — detailed technical engineering. The architect authors two core documents:
- HLD (High-Level Design) — the conceptual blueprint: module topology selection, routing protocol choices, hierarchical addressing plans, high availability (HA) models, and security boundary matrices.
- LLD (Low-Level Design) — actionable implementation documentation: physical rack layouts, port assignment sheets, configuration templates, and NRFU (Network Ready for Use) acceptance test plans. - Implement — hardware staging, structured cabling, configuration, and migration execution according to the LLD without disrupting production workflows.
- Operate — day-to-day network maintenance, configuration management, and ongoing service level agreement (
SLA) compliance tracking managed by the NOC. - Optimize — proactive bottleneck identification, link utilization trend forecasting, and planned redesign before critical service degradation occurs. The findings from this phase feed directly into the next
Preparephase.
| PPDIOO Phase | Primary Phase Objective | Key Inputs | Key Deliverables | Network Architect Role |
|---|---|---|---|---|
Prepare | Strategic and financial justification | Corporate strategy, budget, regulations | Business case, technical requirements charter | Lead (sets architectural vision) |
Plan | Existing network and risk assessment | As-Is telemetry, facility plans, link audits | Audit report, design constraints matrix | Lead (identifies technical bottlenecks) |
Design | Comprehensive engineering specification | Business requirements, Plan findings | HLD, LLD documents, NRFU test suite | Exclusive (author and design authority) |
Implement | Network commissioning into production | LLD package, scheduled change windows | Acceptance test sign-off, NRFU verification | Supervisory (validates deployment fidelity) |
Operate | Day-2 availability and service assurance | Operational playbooks, SLA dashboards | Incident post-mortems, uptime reports | Advisory (escalation for systemic flaws) |
Optimize | Proactive tuning and capacity planning | NetFlow trends, resource telemetry | Modernization roadmap, redesign proposal | Lead (shapes next-generation expansion) |
Business requirements vs. technical metrics
A frequent mistake among novice designers is attempting to defend network capital requests using technical jargon: «We need dual Catalyst 9600 chassis with 100G optics and sub-second BFD». Executive leadership hears only an expensive equipment bill. The architect must translate technical features into clear business value:
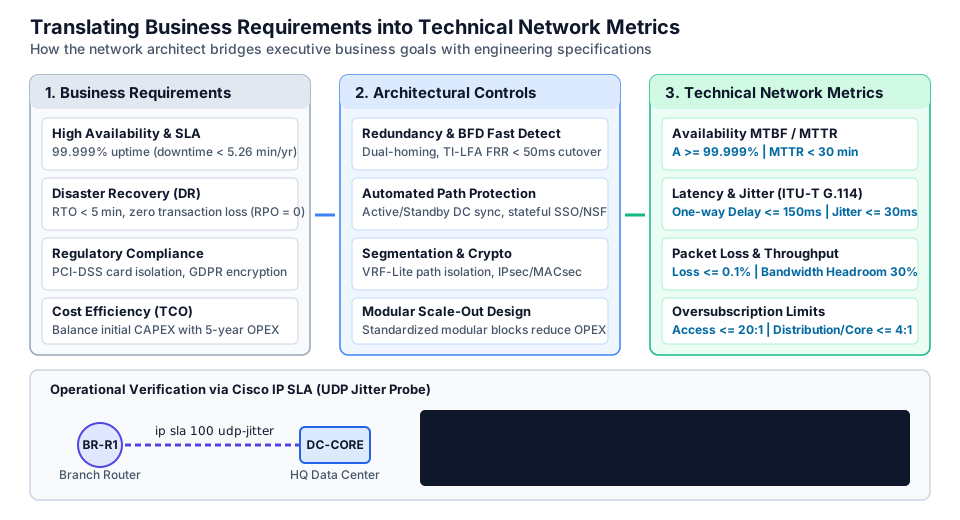
1. Business Continuity and Disaster Recovery
- RTO (Recovery Time Objective) — the maximum tolerable duration of service outage following a disaster before acceptable business operations must be restored. If card payment processing has an
RTO = 5 minutes, the underlying network must achieve automated sub-second failover without relying on on-call engineers. - RPO (Recovery Point Objective) — the maximum age of data that can be permanently lost when disaster strikes. If
RPO = 0, real-time synchronous database replication between data centers is mandatory, demanding network round-trip time (RTT) strictly below5–10 mswith zero packet drop.
2. SLA Availability and the Law of Nines
A Service Level Agreement (SLA) legally defines the guaranteed percentage of time an infrastructure remains operational. Availability $A$ is derived from Mean Time Between Failures (MTBF) and Mean Time To Repair (MTTR):
$$A = \frac{\text{MTBF}}{\text{MTBF} + \text{MTTR}}$$
Every additional «nine» in an SLA contract exponentially reduces the allowed annual downtime window:
| Availability Level | Allowed Annual Downtime | Allowed Monthly Downtime | Allowed Weekly Downtime | Typical Network Design Requirements |
|---|---|---|---|---|
99.0% (Two Nines) | 87.6 hours (3.65 days) | 7.3 hours | 1.68 hours | Single router, single ISP, manual failover |
99.9% (Three Nines) | 8.76 hours (525.6 min) | 43.8 minutes | 10.1 minutes | Backup link, cold standby hardware on shelf |
99.99% (Four Nines) | 52.56 minutes | 4.38 minutes | 1.01 minutes | Dual redundant nodes, FHRP, dynamic IGP reroute |
99.999% («Five Nines») | 5.26 minutes (315 sec) | 26.3 seconds | 6.05 seconds | Full 2N redundancy, BFD/LFA cutover < 50 ms, dual fiber routes |
3. Financial Constraints: CAPEX vs. OPEX
The architect evaluates infrastructure investments through Total Cost of Ownership (TCO = CAPEX + N × OPEX):
- CAPEX (Capital Expenditures) — one-time procurement and setup costs: chassis purchases, optic transceivers, perpetual software licensing, and physical structured cabling.
- OPEX (Operational Expenditures) — recurring operating costs: leased WAN line fees, vendor support contracts (Cisco Smart Net Total Care), facility power and cooling, and engineering labor.
Selecting an entry-level switch based solely on low purchase price (low CAPEX) often results in high power consumption, expensive proprietary optics, and frequent software defects, elevating 5-year OPEX far beyond the cost of an enterprise-grade modular platform.
Worked example: calculating downtime budget and financial impact
Let us calculate the allowable downtime budget for a financial institution and compare outage costs against the capital investment required for core hardware redundancy:
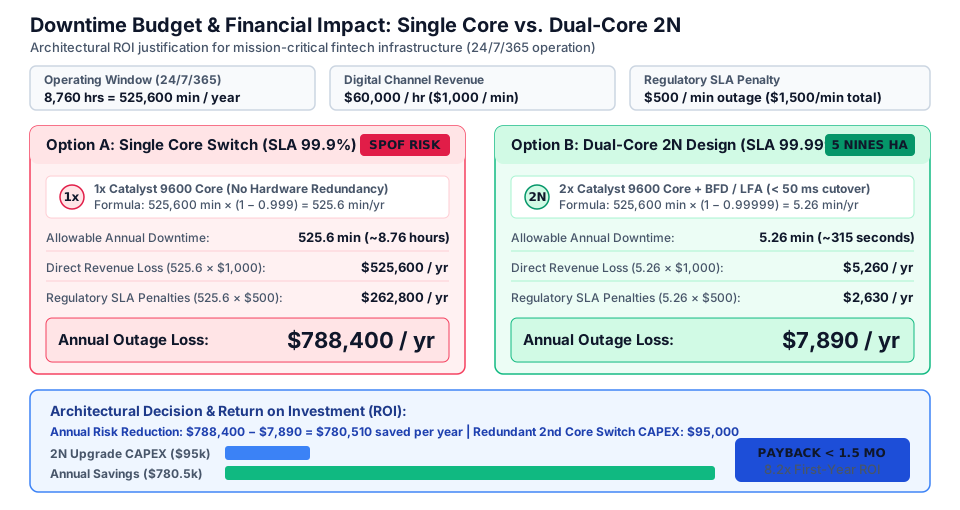
Baseline Business Parameters (Given):
- Annual operating window:
24/7/365=8,760 hours(525,600 minutesper year). - Digital channel revenue rate:
\$60,000 per hour(\$1,000 per minute). - Contractual regulatory SLA penalty:
\$25,000per incident +\$500per minute of outage (combined outage burn rate —\$1,500 / min).
| Design Parameter | Option A: Single Core Switch | Option B: Dual-Core 2N Redundancy |
|---|---|---|
| Target Availability SLA | 99.9% («Three Nines») | 99.999% («Five Nines») |
| Redundancy Architecture | 1× Catalyst 9600 Core switch (SPOF) | 2× Catalyst 9600 Core + BFD / LFA < 50 ms |
| Allowable Annual Downtime | 525.6 minutes (~8.76 hours) | 5.26 minutes (~315 seconds) |
Direct Revenue Loss ($1,000/min) | \$525,600 / year | \$5,260 / year |
Regulatory SLA Penalties ($500/min) | \$262,800 / year | \$2,630 / year |
| Total Annual Financial Loss | \$788,400 / year | \$7,890 / year |
| Additional Hardware Cost (CAPEX) | \$0 (baseline budget) | +\$95,000 (second chassis + diverse fiber) |
Step-by-step mathematical verification for the executive investment committee:
# Annual Downtime Formula: Downtime = 525600 min * (1 - Availability)
Option A (Single Core 99.9%):
  Annual Downtime: "525600 * (1 - 0.999) = 525.6 min (8.76 hrs)"
  Financial Loss: "(525.6 * $1000) + (525.6 * $500) = $788,400 / year"

Option B (Dual-Core 2N 99.999%):
  Annual Downtime: "525600 * (1 - 0.99999) = 5.26 min (315 sec)"
  Financial Loss: "(5.26 * $1000) + (5.26 * $500) = $7,890 / year"

Investment Justification (ROI):
  Avoided Annual Loss: "$788,400 - $7,890 = $780,510 saved per year"
  Redundancy CAPEX: "$95,000 (second Catalyst 9600 + diverse optics)"
  Payback Period: "$95,000 / ($780,510 / 12 mo) = 1.46 months (< 64 min of avoided outage)"
💡 Architectural Verdict: upgrading from
99.9%to99.999%saves the business\$780,510per year. The\$95,000CAPEX for a second core switch pays for itself in under 1.5 months of operation (or during the first 64 minutes of an avoided outage). The 2N redundant design is mathematically and financially justified.
Gathering baseline data: Top-Down vs. Bottom-Up and network audit
In network architecture, requirements discovery follows two opposing methodologies:
- Bottom-Up Design (Legacy): an engineer starts at Layer 1: «We have five spare switches in inventory and surplus Cat5e patch cords. Let us patch them together and route traffic over them». This leads to unexpected bottlenecks, degraded real-time applications, and costly emergency redesigns within months.
- Top-Down Design (Cisco Best Practice): the architect begins at the application layer of the OSI model:
- Step 1: Which applications serve business processes (VoIP, video collaboration, ERP, database clustering)?
- Step 2: What are the specific throughput, delay, jitter, and packet loss tolerances for each application?
- Step 3: Where are the consumers and providers located (traffic flow matrix)?
- Step 4: What Layer 2/3 protocols and QoS queuing mechanisms are required to guarantee performance?
- Step 5: What physical platforms and link topologies are required to support these logical designs?
| Comparison Metric | Top-Down Approach (Recommended) | Bottom-Up Approach (Legacy) |
|---|---|---|
| Starting Point | Business objectives and application SLA requirements | Existing hardware and legacy cabling |
| Scalability | 3-to-5 year growth headroom designed into the foundation | Artificially capped by legacy chassis limitations |
| Quality for Critical Services | Guaranteed by deterministic QoS policies and SLA targets | Ad-hoc, vulnerable to buffer bloat and drops |
| Budget Efficiency | Capital targeted specifically at critical bottlenecks | Funds wasted on reactive fixes and patchwork |
| When Applicable | Green-field networks and major strategic modernizations | Minor local patch modifications |
Application traffic matrix and design constraints
During baseline discovery, the architect drafts an application traffic matrix and defines architectural constraints:
- Technical constraints: existing fiber types (single-mode OS2 vs. multi-mode OM1/OM3), maximum cable distance limits (100 m for copper), and rack power/cooling capacities.
- Organizational constraints: security segregation mandates (isolating ATM transaction traffic from corporate LANs) and maintenance window policies (maintenance restricted to 02:00–05:00 Sundays).
- Budgetary constraints: fixed CAPEX limits for the current fiscal quarter.
Worked example: traffic profiling and SLA validation via Cisco IP SLA
Let us compile application requirements into an engineering QoS specification matrix and validate link performance using Cisco IP SLA probes:
| Application | Protocol & Port | Bandwidth / Stream | One-Way Latency | Jitter (Max) | Loss (Max) | QoS Class (DSCP) |
|---|---|---|---|---|---|---|
| IP Telephony (VoIP) | UDP / RTP | 80 Kbps (G.711) | <= 150 ms | <= 30 ms | <= 1.0% | EF (DSCP 46) |
| Video Meetings (HD) | UDP / RTP | 2.5 Mbps | <= 150 ms | <= 30 ms | <= 0.5% | AF41 (DSCP 34) |
| Core Banking ERP | TCP / 443 | 128 Kbps | <= 200 ms | N/A | <= 0.1% | AF21 (DSCP 18) |
| DB Sync (DR) | TCP / 1521 | 500 Mbps (burst) | <= 10 ms (RTT) | <= 2 ms | 0.0% | AF11 (DSCP 10) |
| Guest Wi-Fi | TCP/UDP | Best-Effort | <= 400 ms | N/A | <= 3.0% | DF (DSCP 0) |
To continuously verify that the transport network honors these parameters, a Cisco IP SLA UDP Jitter probe is deployed from the branch router towards the primary data center:
BR-R1(config)# ip sla 100
BR-R1(config-ip-sla)# type udp-jitter 10.100.1.1 50000 num-packets 100 interval 20
BR-R1(config-ip-sla-jitter)# request-data-size 160
BR-R1(config-ip-sla-jitter)# frequency 60
BR-R1(config-ip-sla-jitter)# threshold 150
BR-R1(config-ip-sla-jitter)# tos 184
BR-R1(config-ip-sla-jitter)# exit
BR-R1(config)# ip sla schedule 100 life forever start-time now

BR-R1# show ip sla statistics 100
IPSLAs Latest Operation Statistics
IPSLA operation id: 100
Type of operation: udp-jitter
Latest operation start time: 10:14:22 UTC
Latest operation return code: OK
RTT Values:
  Number of RTT: 100
  RTT Min/Avg/Max: 22/28/35 milliseconds
Latency one-way values:
  Number of Latency one-way Samples: 100
  Source to Destination Latency Min/Avg/Max: 11/14/18 milliseconds
  Destination to Source Latency Min/Avg/Max: 11/14/17 milliseconds
Jitter values:
  Source to Destination Jitter Min/Avg/Max: 1/2/4 milliseconds
  Destination to Source Jitter Min/Avg/Max: 1/2/3 milliseconds
Packet Loss values:
  Packet Loss from Source to Destination: 0
  Packet Loss from Destination to Source: 0
  Out of Sequence: 0, Late Arrivals: 0
SLA Threshold Over-Occurrences: 0
Analyzing the show ip sla statistics 100 output:
Source to Destination Latency Avg: 14 ms— one-way delay is 10 times better than the150 msITU-T G.114 threshold;Jitter Avg: 2 ms— packet delay variation is well within the30 msceiling;Packet Loss: 0— zero packets were dropped during the 100-packet probe cycle;- The link comfortably satisfies architectural SLA requirements for both voice collaboration and mission-critical financial transactions.
What can go wrong and how to find it
| Design flaw / Symptom | Network consequence | How to design correctly |
|---|---|---|
| Bottom-Up design executed without application traffic matrix | Buffer overflow during peak business hours degrades real-time voice calls and video meetings | Start from business applications (Top-Down), calculate peak traffic volume, and deploy QoS policies |
Promising 99.999% availability without factoring failover convergence time | When a physical fiber breaks, legacy routing timers take 30–45s to reconverge, exhausting the annual downtime budget instantly | Implement sub-second BFD (<= 150 ms) coupled with Loop-Free Alternate Fast Reroute (LFA / TI-LFA < 50 ms) |
| Overlooking common Single Points of Failure (SPOF) in physical plant | Power outage or electrical room fire knocks out both redundant router chassis simultaneously | Mandate diverse physical conduit paths, dual power feeds (ATS, generator), and geographically separated equipment rooms |
| Procuring hardware on lowest CAPEX without calculating total cost of ownership | Over 3 to 5 years, excessive power draw, expensive proprietary optics, and software bugs consume triple the initial savings | Calculate Total Cost of Ownership (TCO = CAPEX + N * OPEX) over a 3-to-5 year window before approving procurement |
⚠️ Typical architect mistake: guaranteeing «five nines» (
99.999%) availability to executive leadership by installing two high-end routers in the same rack, while overlooking that both ISP fiber circuits enter the building through the same basement pipe, and both power supplies plug into the same electrical circuit breaker. Any single physical plant disruption instantly invalidates all investments in protocol redundancy.
Practice
- Predict. A telecom carrier offers an enterprise a leased line contract with an SLA availability of
99.95%. What is the maximum cumulative allowable unplanned downtime (in minutes) permitted under this contract during a 30-day billing cycle? - Verify. An enterprise router has a vendor-rated mean time between failures of
MTBF = 100,000 hours. The certified service level agreement guarantees an on-site engineer replacement time ofMTTR = 5 hours. Calculate the availability ratio of this standalone router and determine if a single unit can satisfy a99.999%SLA requirement. - Explain. Why does a Top-Down network design audit always begin with interviews with business unit leaders and application owners rather than collecting running configurations from access switches?
- Modify. In the provided
ip sla 100UDP Jitter configuration, the threshold is configured to150 ms. Modify this configuration for a data center synchronous replication link where the maximum acceptable one-way latency is15 ms, and the probe frequency must execute every10 seconds. - Design it yourself ⭐. Formulate architectural specifications for a regional hospital's telemedicine network:
50operating theaters broadcasting 4K endoscopic surgical streams (25 Mbpsper theater, maximum latency50 ms, packet loss0%). Formulate the availability SLA, calculate aggregated core bandwidth, assess RTO/RPO criticality, and specify redundancy mechanisms to eliminate single points of failure.
Self-check
Question 1. What is the fundamental architectural distinction between RTO (Recovery Time Objective) and RPO (Recovery Point Objective), and what specific network engineering mechanisms does the architect deploy to satisfy each objective?
- Analysis: RTO defines the maximum acceptable duration of service downtime following an outage (how rapidly the network must restore connectivity). The architect satisfies RTO using hardware redundancy, sub-second failover protocols (
BFD,LFA FRR), and gateway clustering (FHRP,StackWise Virtual). RPO defines the maximum allowable data loss measured in time. SatisfyingRPO = 0requires the network to provide deterministic ultra-low latency (RTT < 5–10 ms), minimal jitter, and zero packet loss to sustain real-time synchronous database replication between data centers.
Question 2. In the command output of show ip sla statistics 100, a network engineer observes the following values: RTT Avg: 185 ms, Source to Destination Latency Avg: 94 ms, Source to Destination Jitter Max: 48 ms, and Packet Loss: 12. Does this WAN link satisfy enterprise standards for VoIP telephony?
- Analysis: The link violates enterprise voice standards. While the one-way delay of
94 mstechnically falls below the ITU-T G.114 threshold of<= 150 ms, the maximum jitter of48 msexceeds the allowable30 msceiling (causing jitter buffer underflow and robotic voice artifacts). Furthermore,12dropped packets will result in audible clipping and lost syllables during voice calls.
Answers to practice:
- A 30-day month consists of
30 * 24 * 60 = 43,200 minutes. With99.95%availability, the allowable downtime is:43,200 * (1 - 0.9995) = 43,200 * 0.0005 = 21.6 minutesper month. - $A = \frac{100,000}{100,000 + 5} = \frac{100,000}{100,005} \approx 0.99995$ (
99.995%). This corresponds to four nines (~26 minutes of downtime per year). A single standalone router cannot meet a99.999%SLA (maximum 5.26 minutes per year); therefore, a dual-homed redundant architecture with automated failover is required. - The network exists solely to deliver application traffic for business processes. Starting from switch configurations (Bottom-Up) reveals only legacy ports, omitting planned service expansions, transaction criticality, and business bottlenecks. Top-Down discovery identifies critical requirements first, enabling infrastructure to be engineered cost-effectively.
- For the low-latency synchronous replication link, the probe is tuned with a tighter frequency and threshold:
ip sla 100
 threshold 15
frequency 10- Telemedicine network design specifications:
- Video traffic bandwidth:50 theaters * 25 Mbps = 1.25 Gbpspayload. Factoring in management overhead, telemetry, and a 30% growth buffer, total core bandwidth should be at least2 × 10 Gbps.
- Availability SLA:99.999%(communication loss during surgery endangers patient lives).RTO = 0(instantaneous failover),RPO = 0.
- Eliminating SPOF: each theater connects via dual diverse cabling paths to redundant access switches; distribution switches form a dual-homed cluster with40Guplinks to the core; electrical power is configured with 2N redundancy (dual independent UPS and backup diesel generator); video traffic is prioritized withDSCP AF41/EF.
Review and the criterion for moving on
You are ready to move on if without hints you can:
- list all 6 phases of the Cisco PPDIOO network lifecycle and explain the architect's specific responsibilities in each;
- distinguish between RTO, RPO, MTBF, and MTTR and translate business continuity goals into network KPIs;
- calculate the downtime allowance for any target SLA percentage and justify the investment in redundant hardware;
- explain to executive leadership why Top-Down engineering prevents wasteful expenditures;
- interpret
show ip sla statisticscommand output to determine if a path satisfies real-time traffic tolerances.
Review question (CCNA baseline): why is the connectionless transport protocol UDP preferred over TCP with acknowledgments for real-time interactive voice and video conferencing traffic?
💡 Related deep-dive lessons in other courses: for detailed CLI configuration and troubleshooting, see Hierarchical Campus Design: Access, Distribution, Core, and Oversubscription Sizing.
Standards and sources
- Cisco Validated Design (CVD) — Enterprise Network Design Principles and Methodologies.
- Cisco Exam Blueprint — 300-420 ENSLD v1.1/v1.2, Section
1.1 Translate business requirements into technical network designs (SLA, budget, scale, compliance). - ITU-T Recommendation G.114 — One-way transmission time for voice and multimedia applications.
- IETF RFC 2544 — Benchmarking Methodology for Network Interconnect Devices.
